Monitoring
The following assumes that you have applied the kube-prometheus monitoring stack onto your cluster.
Kilo
Monitor the Kilo DaemonSet with:
kubectl apply -f https://raw.githubusercontent.com/squat/kilo/main/manifests/podmonitor.yaml
WireGuard
Monitor the WireGuard interfaces with:
kubectl create ns kilo
kubectl apply -f https://raw.githubusercontent.com/squat/kilo/main/manifests/wg-exporter.yaml
The manifest will deploy the Prometheus WireGuard Exporter as a DaemonSet and a PodMonitor.
By default the kube-prometheus stack only monitors the default, kube-system and monitoring namespaces.
In order to allow Prometheus to monitor the kilo namespace, apply the Role and RoleBinding with:
kubectl apply -f https://raw.githubusercontent.com/squat/kilo/main/manifests/wg-exporter-role-kube-prometheus.yaml
Metrics
Kilo
Kilo exports some standard metrics with the Prometheus GoCollector and ProcessCollector. It also exposes some Kilo-specific metrics.
# HELP kilo_errors_total Number of errors that occurred while administering the mesh.
# TYPE kilo_errors_total counter

# HELP kilo_leader Leadership status of the node.
# TYPE kilo_leader gauge

# HELP kilo_nodes Number of nodes in the mesh.
# TYPE kilo_nodes gauge

# HELP kilo_peers Number of peers in the mesh.
# TYPE kilo_peers gauge

# HELP kilo_reconciles_total Number of reconciliation attempts.
# TYPE kilo_reconciles_total counter
WireGuard
The Prometheus WireGuard Exporter exports the following metrics:
# HELP wireguard_sent_bytes_total Bytes sent to the peer
# TYPE wireguard_sent_bytes_total counter

# HELP wireguard_received_bytes_total Bytes received from the peer
# TYPE wireguard_received_bytes_total counter

# HELP wireguard_latest_handshake_seconds Seconds from the last handshake
# TYPE wireguard_latest_handshake_seconds gauge
Display some Metrics
If your laptop is a Kilo peer of the cluster you can access the Prometheus UI by navigating your browser directly to the cluster IP of the prometheus-k8s service.
Otherwise use port-forward:
kubectl -n monitoring port-forward svc/prometheus-k8s 9090
and navigate your browser to localhost:9090.
Check if you can see the PodMonitors for Kilo and the WireGuard Exporter under Status -> Targets in the Prometheus web UI.
If you don't see them, check the logs of the prometheus-k8s Pods; it may be that Prometheus doesn't have the permission to get Pods in the kilo namespace.
In this case, you need to apply the Role and RoleBinding from above.
Navigate to Graph and try to execute a simple query, e.g. type kilo_nodes and click on execute.
You should see some data.
Using Grafana
Let's navigate to the Grafana dashboard.
Again, if your laptop is not a Kilo peer, use port-forward:
kubectl -n monitoring port-forward svc/grafana 3000
Now navigate your browser to localhost:3000.
The default user and password is admin admin.
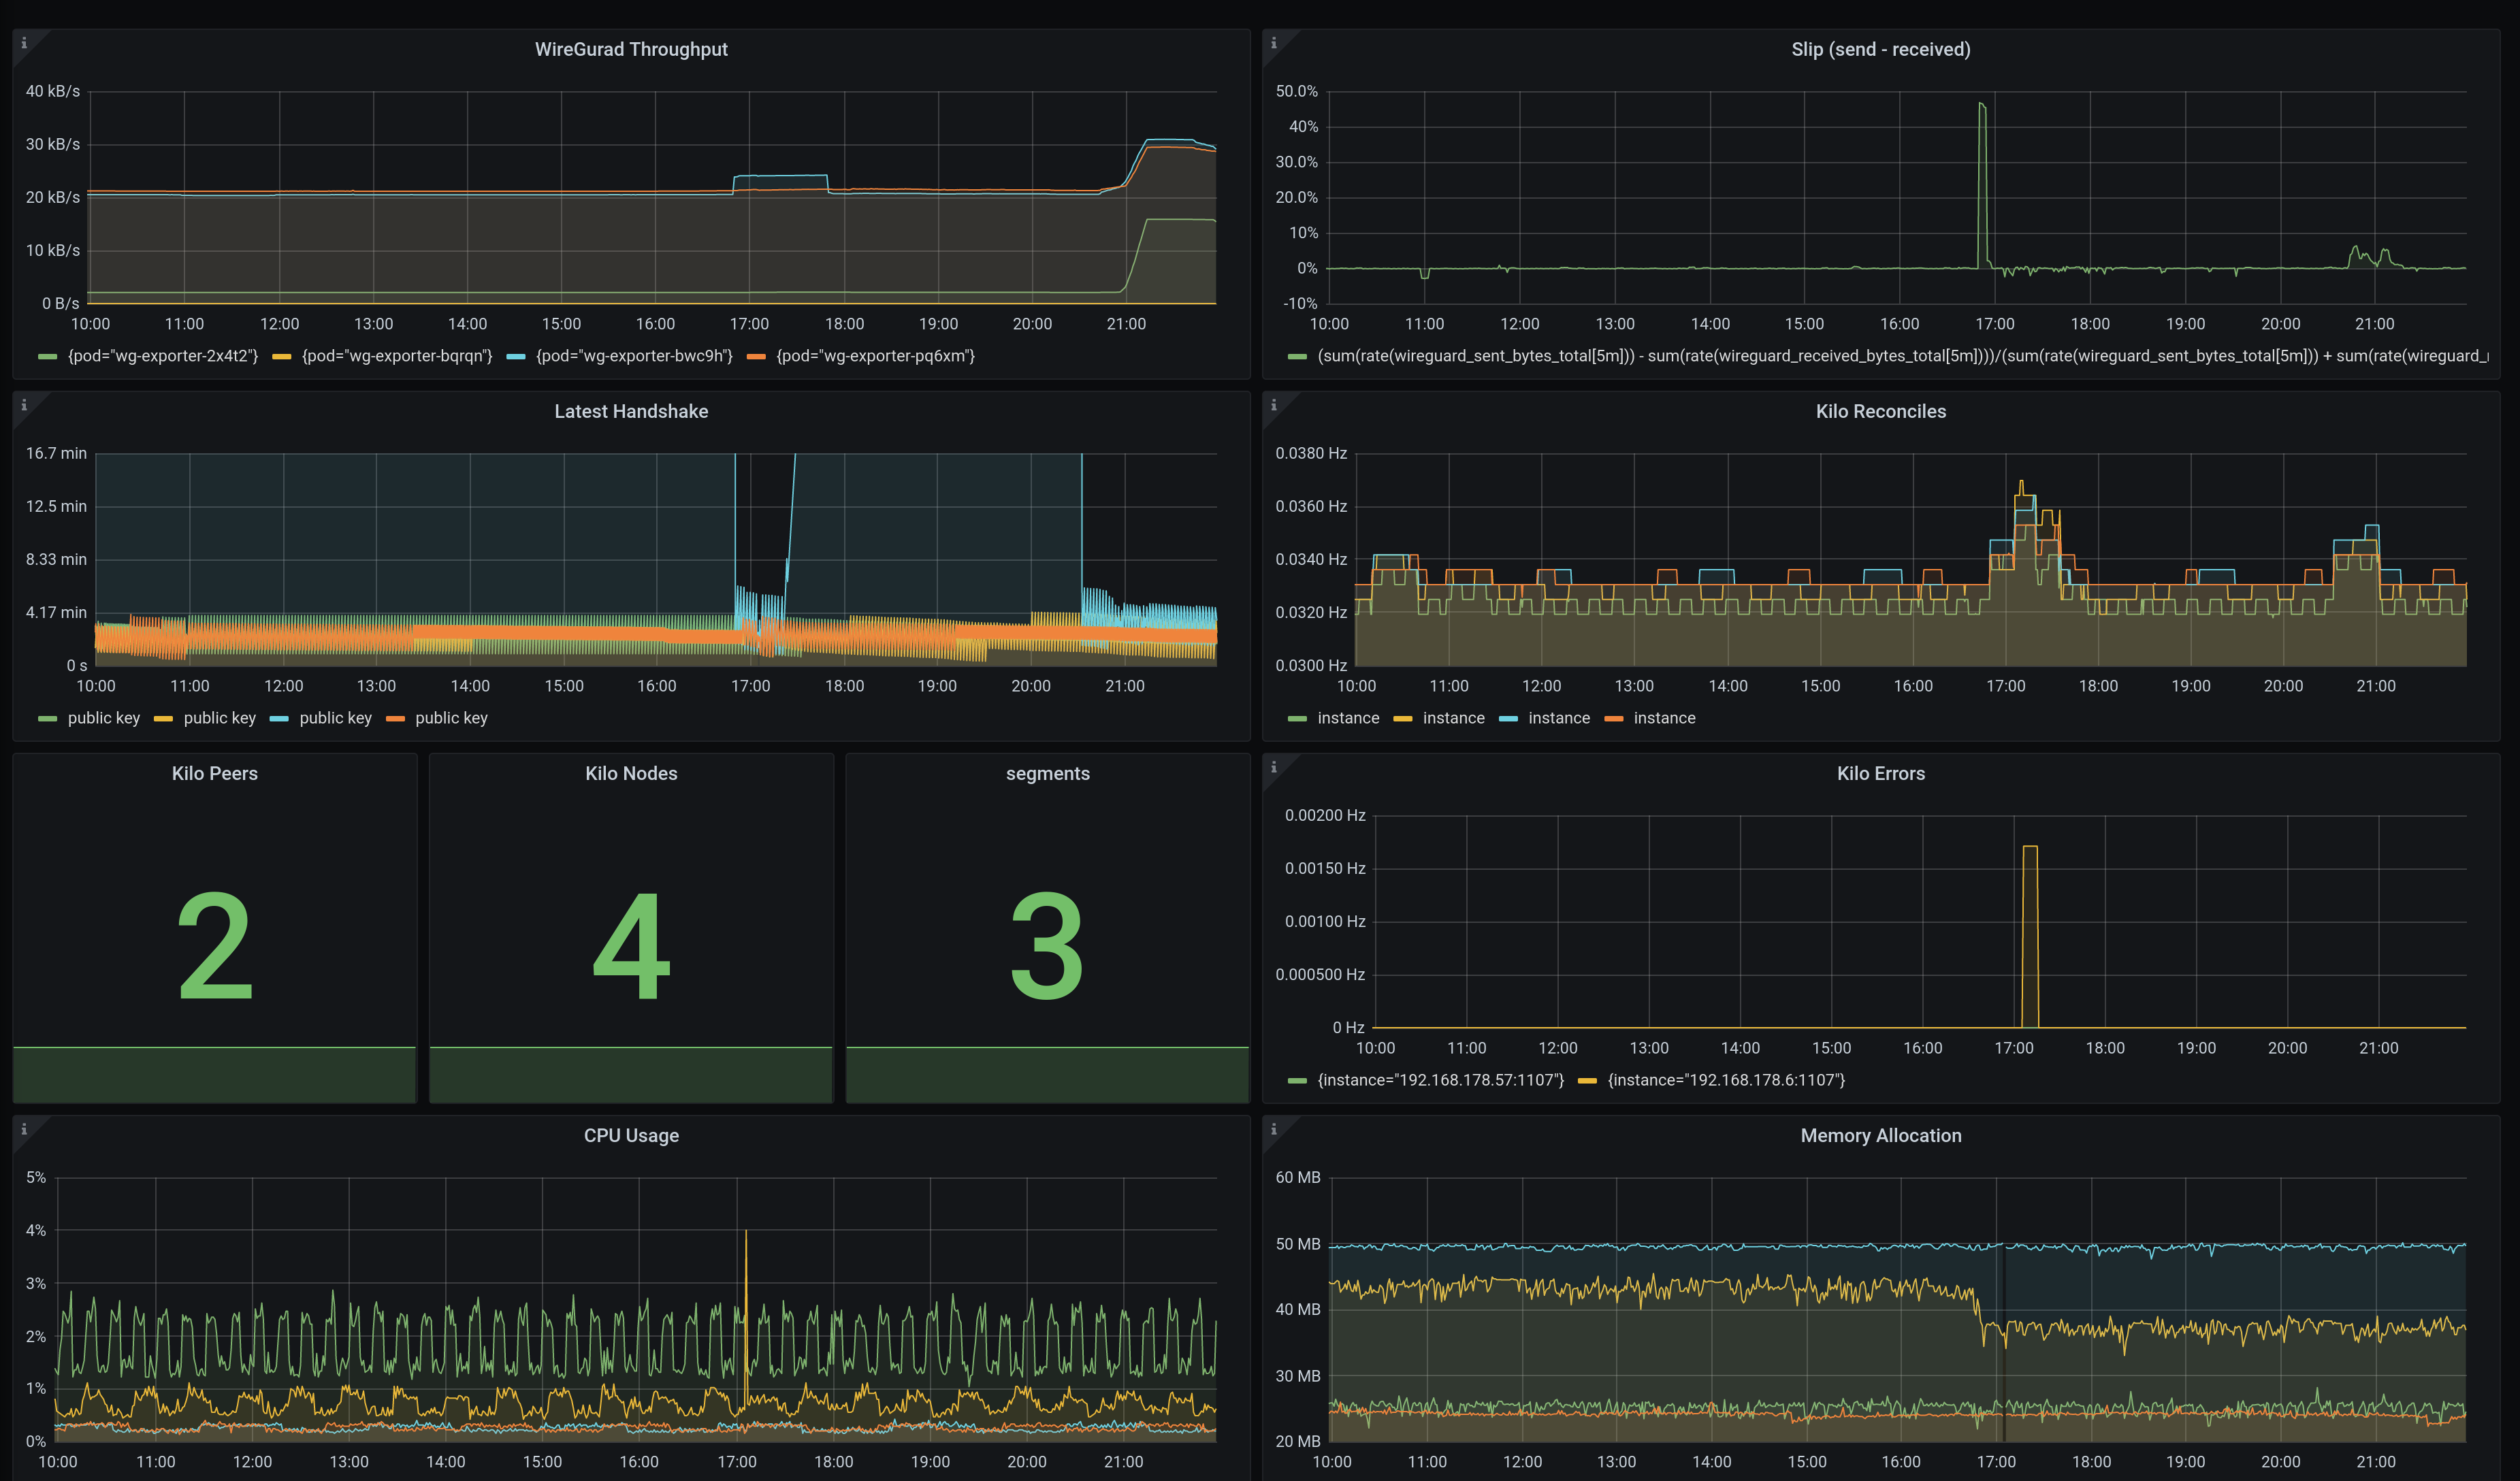
An example configuration for a dashboard displaying Kilo metrics can be found here. You can import this dashboard by hitting + -> Import on the Grafana dashboard.
The dashboard looks like this: